Understanding MARD: Accuracy, or Just an Average?
In the CGM world, MARD has almost become the synonym of accuracy.
When sales teams introduce a product, one of the first questions is:
“What’s your MARD?”
And when competitors launch a new generation, the headline is often:
“Now with lower MARD.”
When MARD keeps getting lower, are we measuring better accuracy — or just better arithmetic?
From a commercial perspective, I prefer to explain MARD in practical sales language.
1- What Is MARD — In Simple Terms?
MARD stands for Mean Absolute Relative Difference .
Let’s forget the formula for a moment.
Here’s what really happens:
Every time a CGM gives a reading, it is compared to a reference value such as YSI.
The difference between the two is calculated
That difference is turned into a percentage
All those percentages are averaged
That final average number is MARD.
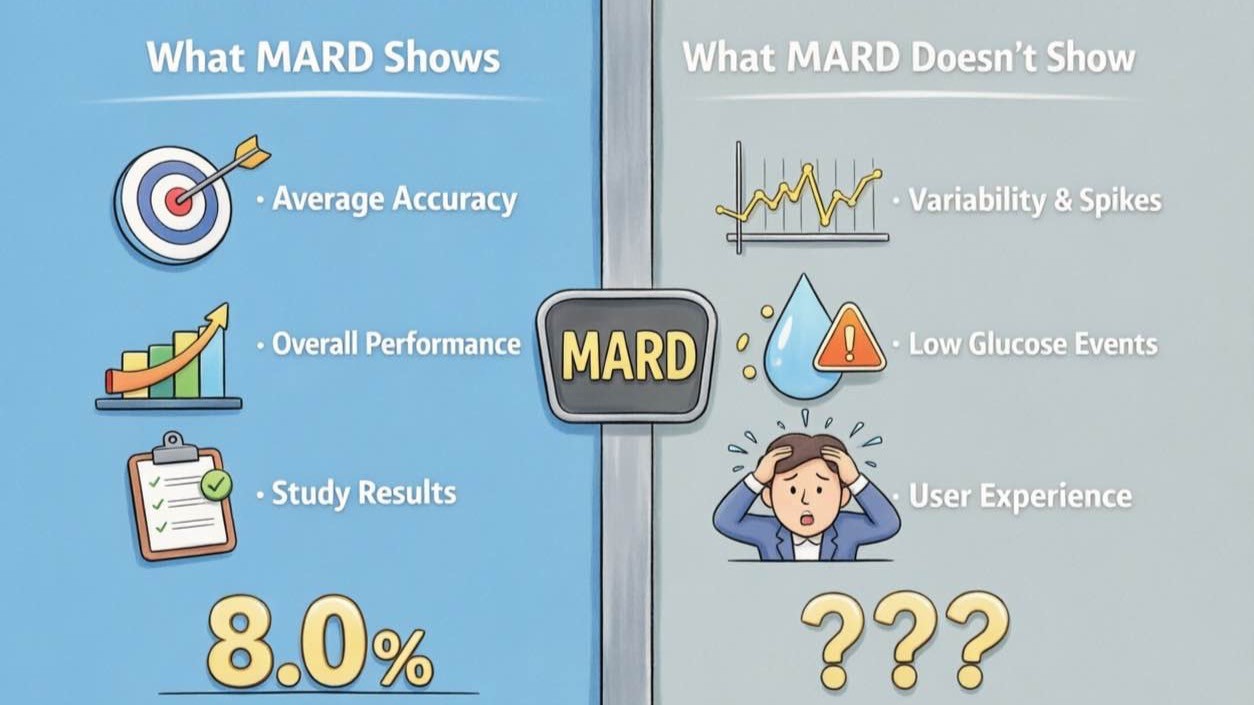
So if a product has a MARD of 8%, it means:
On average, its readings are 8% different from the reference.
The key word here is average .
2-What MARD Can Tell You
For users and commercial teams, MARD is useful because it gives:
✅ A standardized way to compare products
✅ A general indicator of overall accuracy
✅ A regulatory and clinical benchmark
In simple terms:
In general, a lower MARD suggests the system is performing closer to the reference standard.
It shows improvements in:
Sensor chemistry
Algorithm refinement
Calibration models
So yes — MARD matters .
But it is not the whole story.
3-What MARD Does NOT Tell You
This is where misunderstandings happen.
Because MARD is an average, it does not show:
❌ How stable the sensor is on Day 1 vs Day 10
❌ How it performs specifically in hypoglycemia
❌ Whether there are occasional large deviations
❌ How the system behaves in real-world conditions
Imagine two different sensors, both reporting a MARD of 10%. On a spreadsheet, they look identical. In real life, they are worlds apart.
Sensor A: Reading 1 error: 2% | Reading 2 error: 18%. MARD: 10%
Most readings are very close, but occasionally there are large deviations.
Sensor B: Reading 1 error: 10% | Reading 2 error: 10%. MARD: 10%
Every reading is consistently around 10% deviation.
Averages are comfortable. Variability is where risk lives.
4-Why MARD Can Look Better Over Time
In recent years, we’ve seen MARD numbers steadily decline across the industry.
At first glance, it seems simple:
Better technology → Lower MARD.
And yes, engineering improvements absolutely play a major role.
But there is another important factor that we should understand:
1-Which Glucose Ranges Are Included?
MARD is calculated as a relative percentage error.
That means the same absolute difference can look very different depending on the glucose level.
For example:
If the reference glucose is 300 mg/dL and the sensor differs by 15 mg/dL, the relative error is only 5%.
But if the reference glucose is 70 mg/dL and the sensor differs by 15 mg/dL, the relative error jumps above 20%.
So if a clinical study includes:
More mid-to-high glucose values
Fewer hypoglycemic events
The overall MARD will naturally look lower.
MARD is sensitive to the glucose distribution of the study population.
2-Are Early Warm-Up Hours Included?
Most CGM systems are less stable in the first hours after insertion.
If a study:
Includes the first 12–24 hours → MARD may increase
Excludes early stabilization time → MARD may decrease
Both approaches can be justified scientifically.
But the final number will differ.
3-What Study Methodology Is Used?
Even when biochemical analyzers such as YSI are used as the reference standard, study methodology still matters.
What often differs is:
· How frequently samples are collected
· How time alignment is handled
· How data points are matched
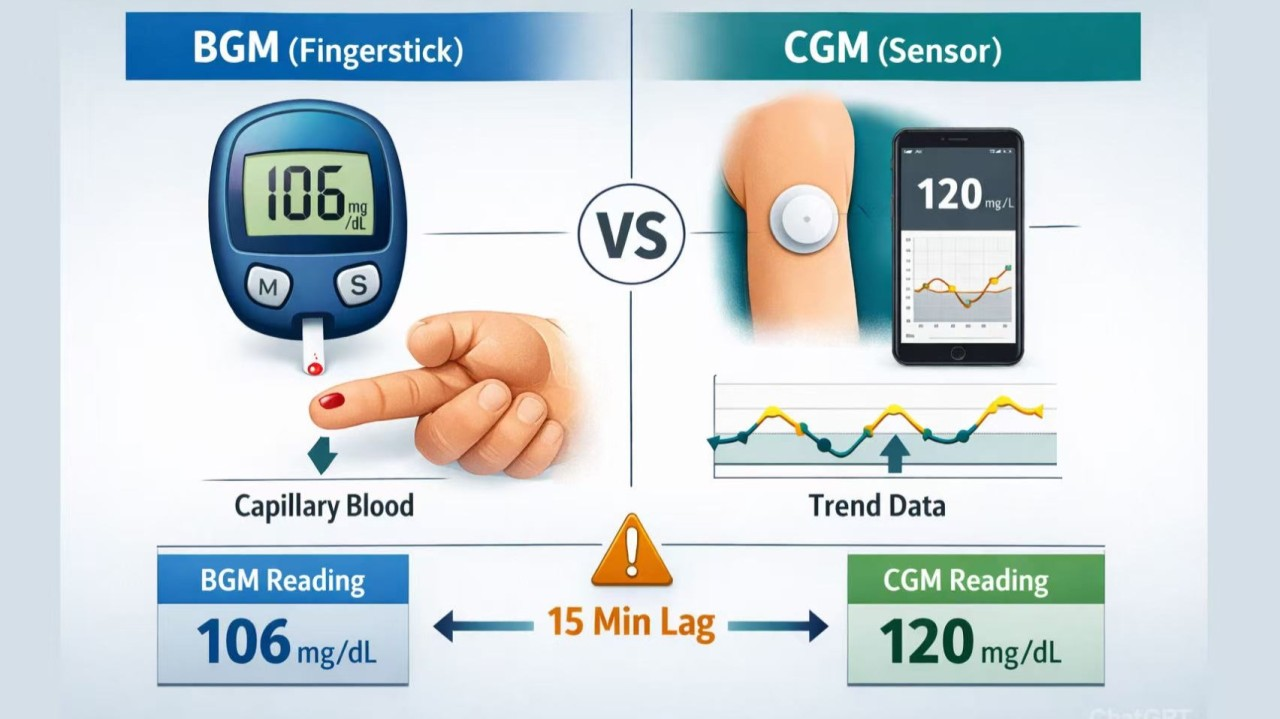
Because CGM readings lag behind blood glucose, even small differences in alignment strategy can influence calculated error.
4-How Large Is the Study Population?
Sample size is often overlooked in commercial discussions.
But it matters.
When a study includes:
- 20 participants
- vs 200 participants
Both may report a MARD of 8%.
But the confidence behind that number is very different.
None of this suggests manipulation.
Clinical studies follow protocols and regulatory standards.
But it does mean that:
As MARD enters the single-digit era, study structure plays a bigger role in how small differences appear.
When the gap between products is 3–4%, engineering dominates.
When the gap is 0.5–0.8%, study design may matter more than people realize.
Final Thought
MARD is a ticket to the game, but it’s not the final score.
It reflects the average under specific study conditions. It signals that a system has reached a certain level of technical maturity.
But in a single-digit era, the conversation must evolve.
The question is no longer simply:
“What is the MARD?”
The more meaningful question is:
“Under what conditions was this MARD achieved?”
Numbers are necessary. They give us benchmarks. They create comparability.
But numbers alone do not define performance.
As the CGM industry matures, competitive advantage will increasingly move beyond arithmetic — toward consistency, real-world validation, and trust.
In the coming years, transparency may matter more than the lowest number.
And whether you are a clinician, distributor, product manager, or patient, understanding that distinction is far more powerful than memorizing a percentage.