Beyond the Reading — CGM Engineering Insights
2026-03-03 · Verid Bio
、
- A Data-Driven Framework for Evaluating CGM Sensors
A Continuous Glucose Monitoring (CGM) system is not defined by a single glucose value. Its real value lies in the quality of the data stream over time — accuracy, consistency, and long-term reliability.
As CGM developers, our challenge is not only to design sensors, but to prove their performance with data.
In this article, we want to share the technical evaluation framework we use internally, moving from abstract performance claims to concrete, measurable metrics.
At its core, a robust CGM sensor evaluation rests on three pillars: Response & Sensitivity, Consistency & Linearity, and Long-term Stability.
Below, we’ll walk through real development data behind each one.
- Response & Sensitivity: The Foundation of Accuracy
The first question is simple but fundamental: Does the sensor respond predictably to glucose concentration?
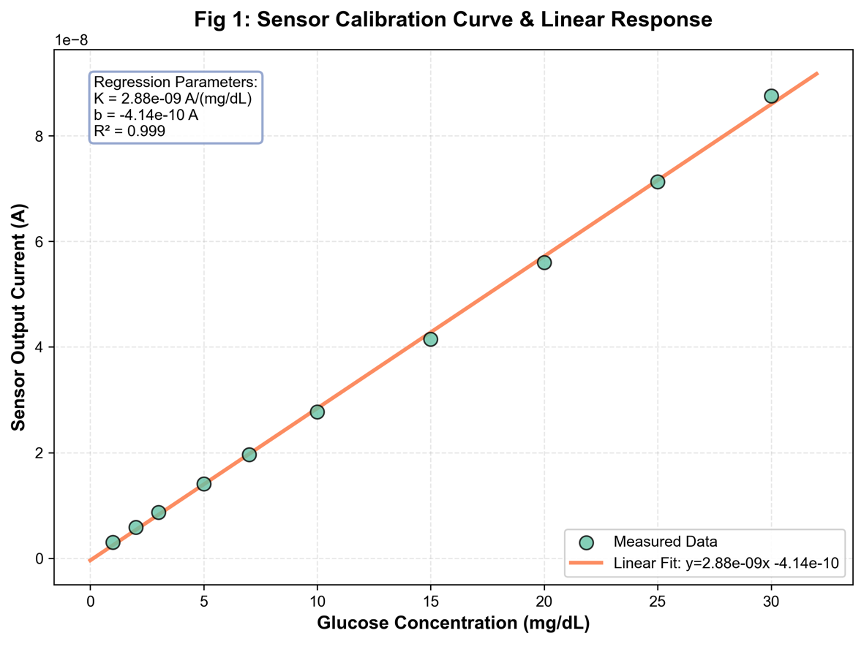
We expose sensors to a controlled range of glucose levels (e.g., 1–30 mg/dL) and measure the resulting electrical output current.
Key Metric: Sensitivity (K value) Sensitivity is defined as the slope of the calibration curve (Output vs. Concentration).
In our test data, the sensitivity was approximately:
K ≈ 2.88 × 10⁻⁹ A/(mg/dL)
A stable and predictable K value is essential — it is the mathematical bridge between raw electrochemical signal and the glucose value reported to the user.
Proof of Predictability: Linearity (R²) Across the tested range, we observed an R² of 0.999 , indicating an excellent linear response.
- Consistency & Linearity: From Good Design to Manufacturable Reality
A strong single-sensor result is not enough. A CGM system must deliver the same performance across thousands of units .
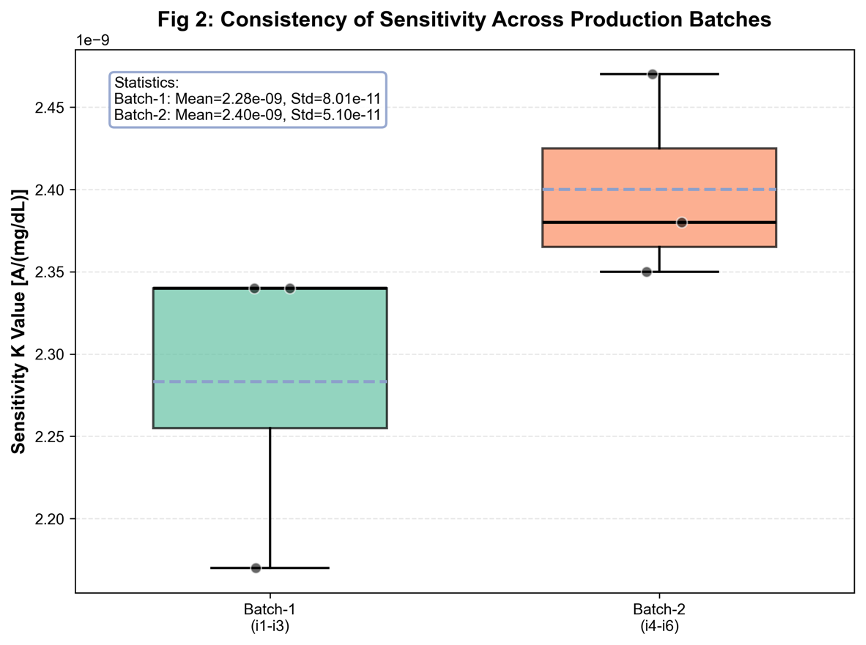
To evaluate this, we tested multiple sensor channels (i1–i6) across different production batches.
The Goal: Minimal variation in sensitivity (K value) across units and batches.
What the Data Showed:
- Batch A average sensitivity: 2.28 × 10⁻⁹ A/(mg/dL)
- Batch B average sensitivity: 2.40 × 10⁻⁹ A/(mg/dL)
- Inter-batch deviation: approximately 2–4%
This level of consistency is critical for scalable manufacturing. It is what allows end users and regulators to trust that any sensor from the box behaves as expected .
3. The Real Test: Long-Term Stability
Short-term accuracy means little if the sensor drifts over time.
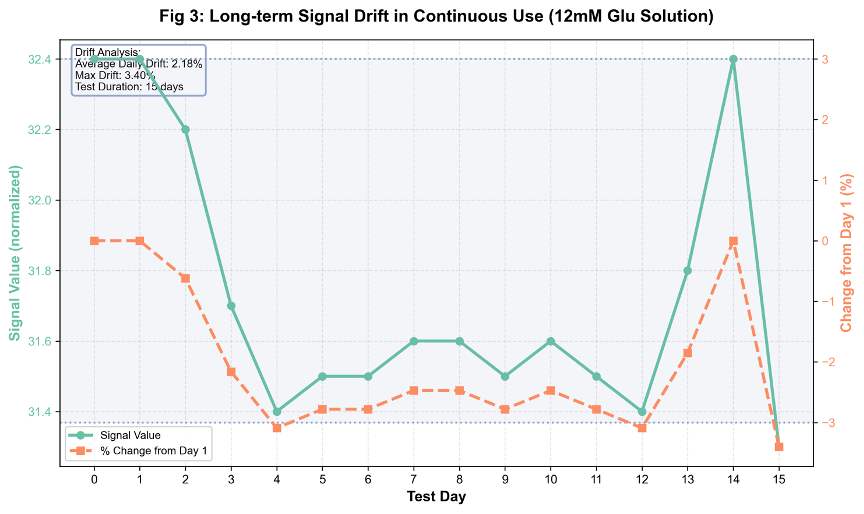
To evaluate long-term performance, we conducted stability testing by continuously monitoring sensor output in a fixed glucose solution over an extended period.
The Result: Over a 15-day test , the average daily signal drift was only 0.77% .
This metric directly reflects the sensor’s ability to maintain calibration integrity and deliver reliable glucose trends — the true value proposition of CGM technology.
What This Means for CGM Innovators
Building a trustworthy CGM sensor requires more than achieving a “good reading” in the lab.
It requires:
- Quantifying sensitivity
- Proving unit-to-unit consistency
- Demonstrating long-term stability
Only by validating all three can we bridge the gap between promising prototypes and reliable, wearable medical devices.
By sharing this framework, we hope to spark discussion around evaluation standards, testing methodologies, and what truly defines quality in the rapidly evolving CGM landscape.
Disclosure: The data and evaluation framework discussed in this article are based on internal engineering testing conducted by the CGM R&D team at Verid Bio . This post is shared from a technical perspective to support professional discussion within the CGM and digital health community.